Why Reactive Inspector?
Reactive programming provides dedicated language abstractions for reactive software. Reactive programming relieves developers from manually updating outputs when the inputs of a computation change, it overcomes a number of well-know issues of the Observer design pattern, and it makes programs more comprehensible. Unfortunately, complementing this paradigm with proper debuggin tools is a vastly unexplored area. The reactive style requires a paradigm shift in the concepts needed for debugging. Traditional debugging has been conceived for imperative languages while reactive programming is declarative. Reactive Inspector is debugger for reactive programs integrated with the Eclipse Scala IDE that allowas to debug sofware in the reactive style.
Features
Reactive Tree
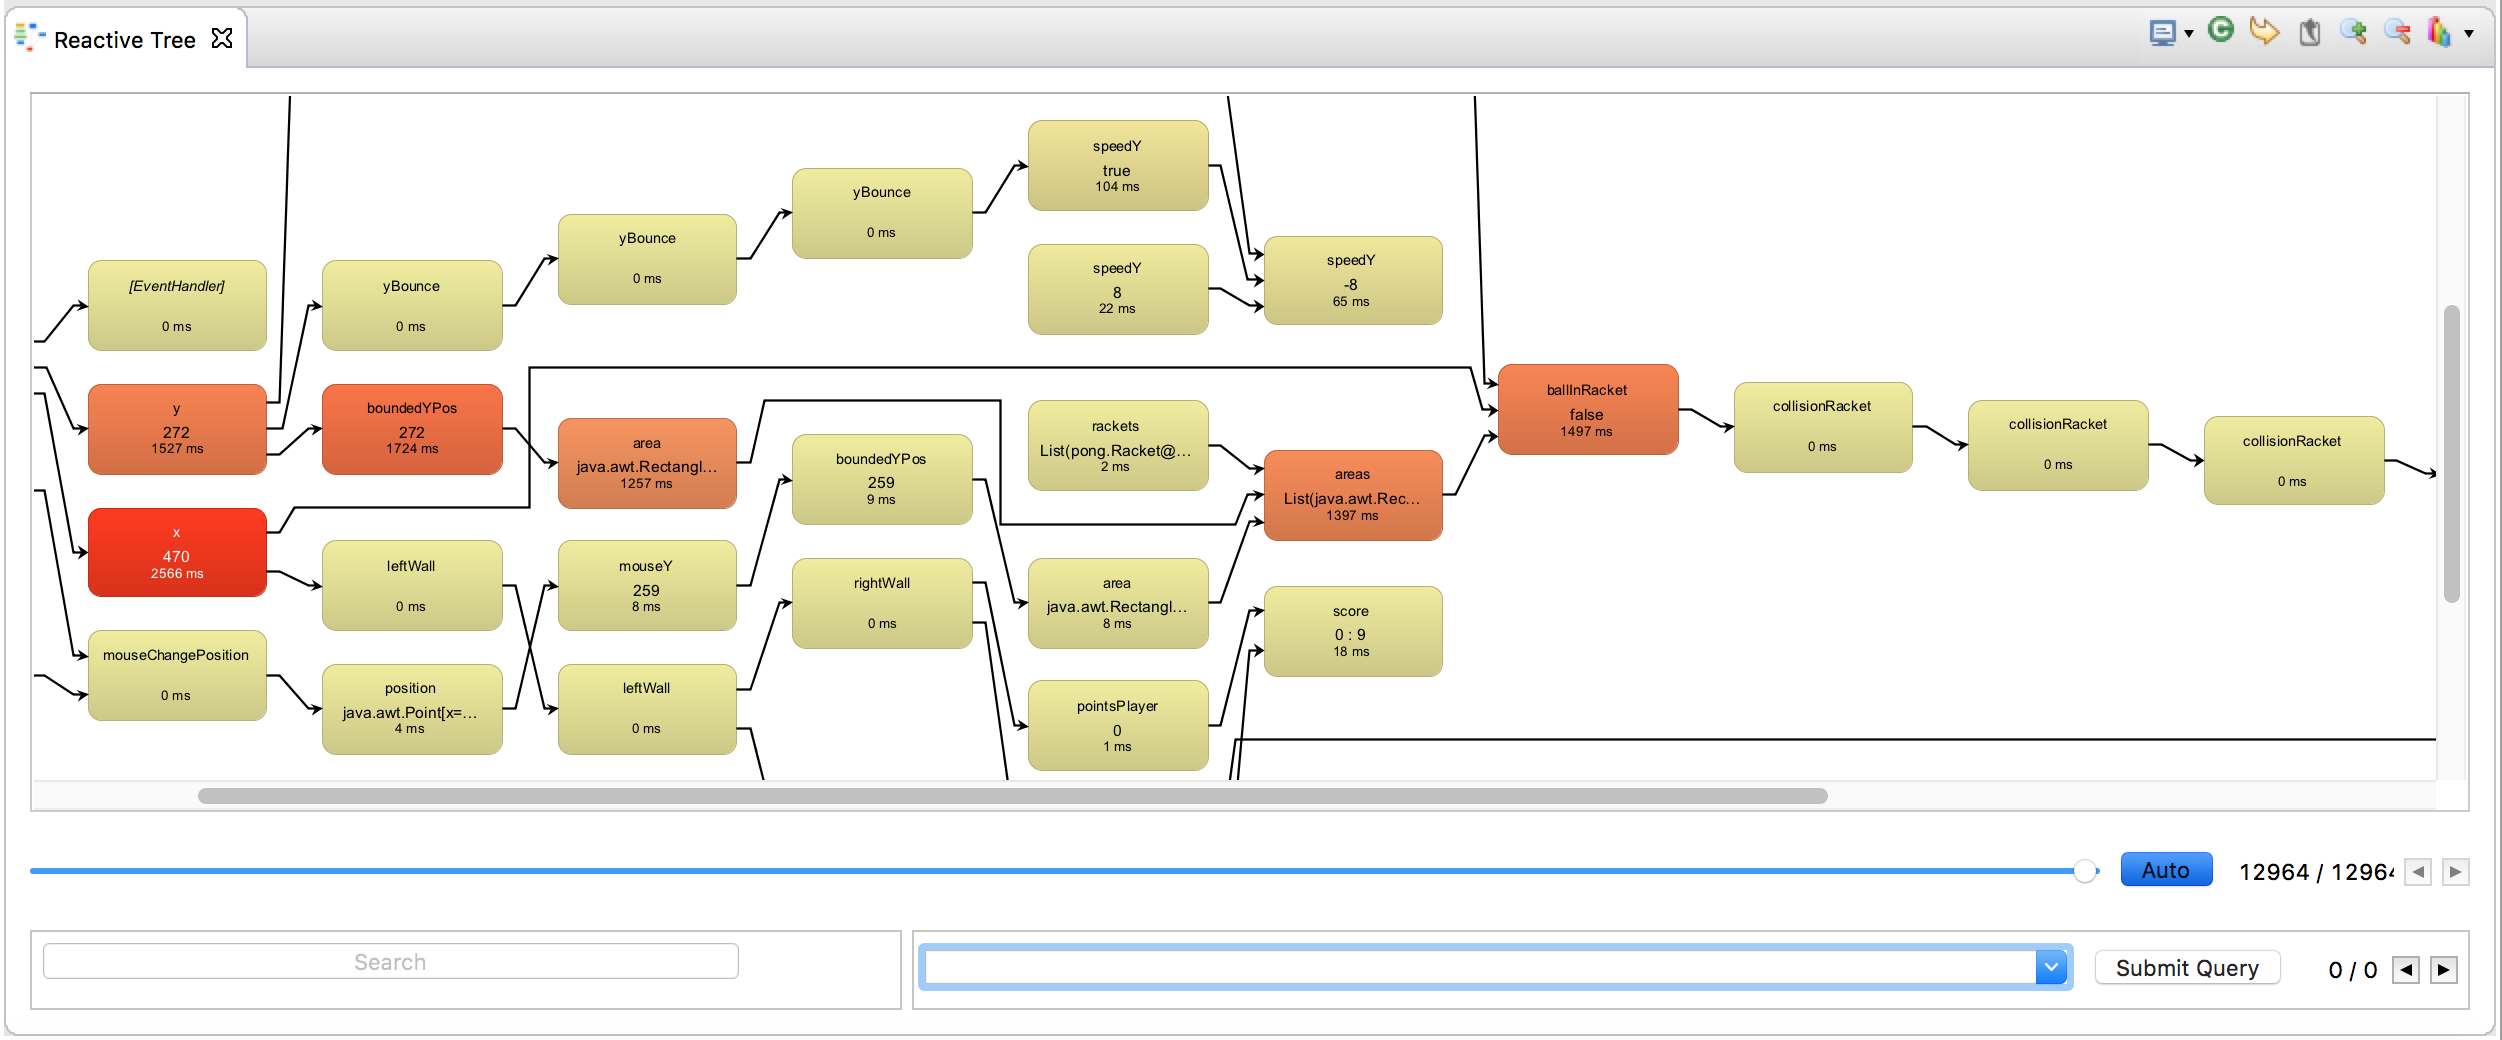
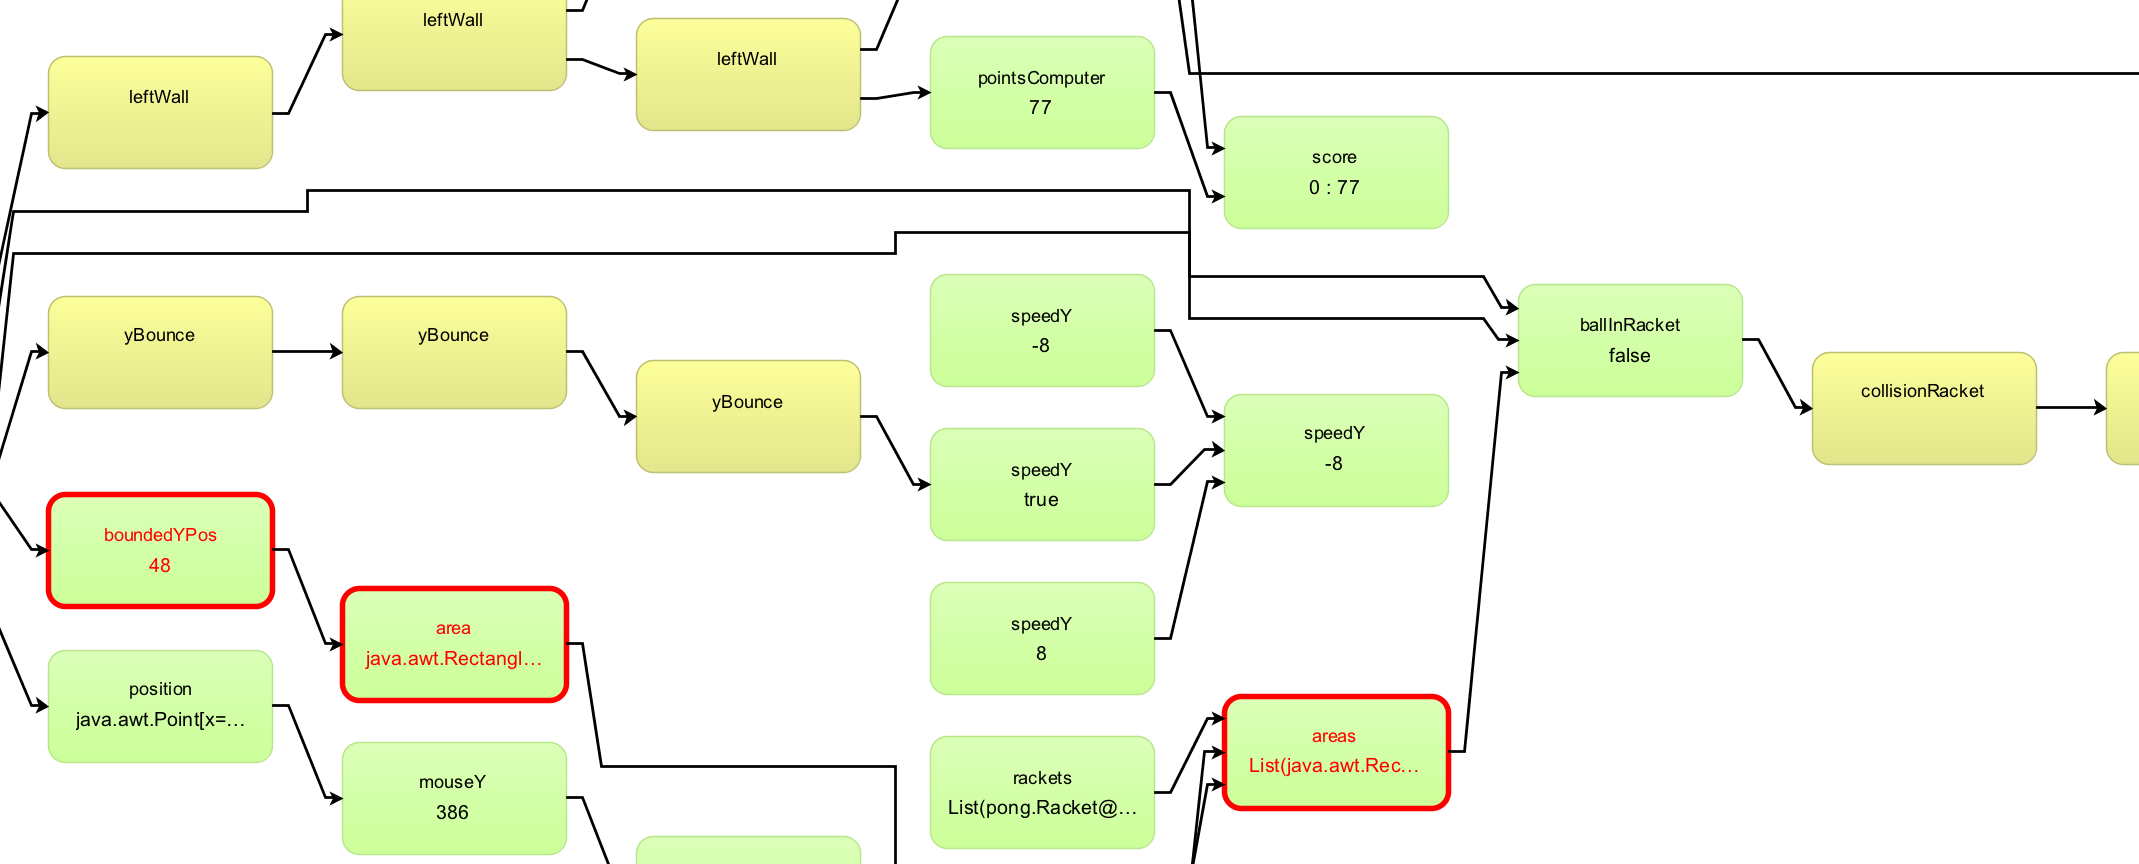 The reactive tree view lets you inspect variables, signals, events and their dependencies in a visualization of the dependency graph for your application. You can observe the values of the individual nodes as they change over time. Also, the tree provides you with visual cues when a significant event occurs, such as a value change or when an exception is thrown.
Tree Outline
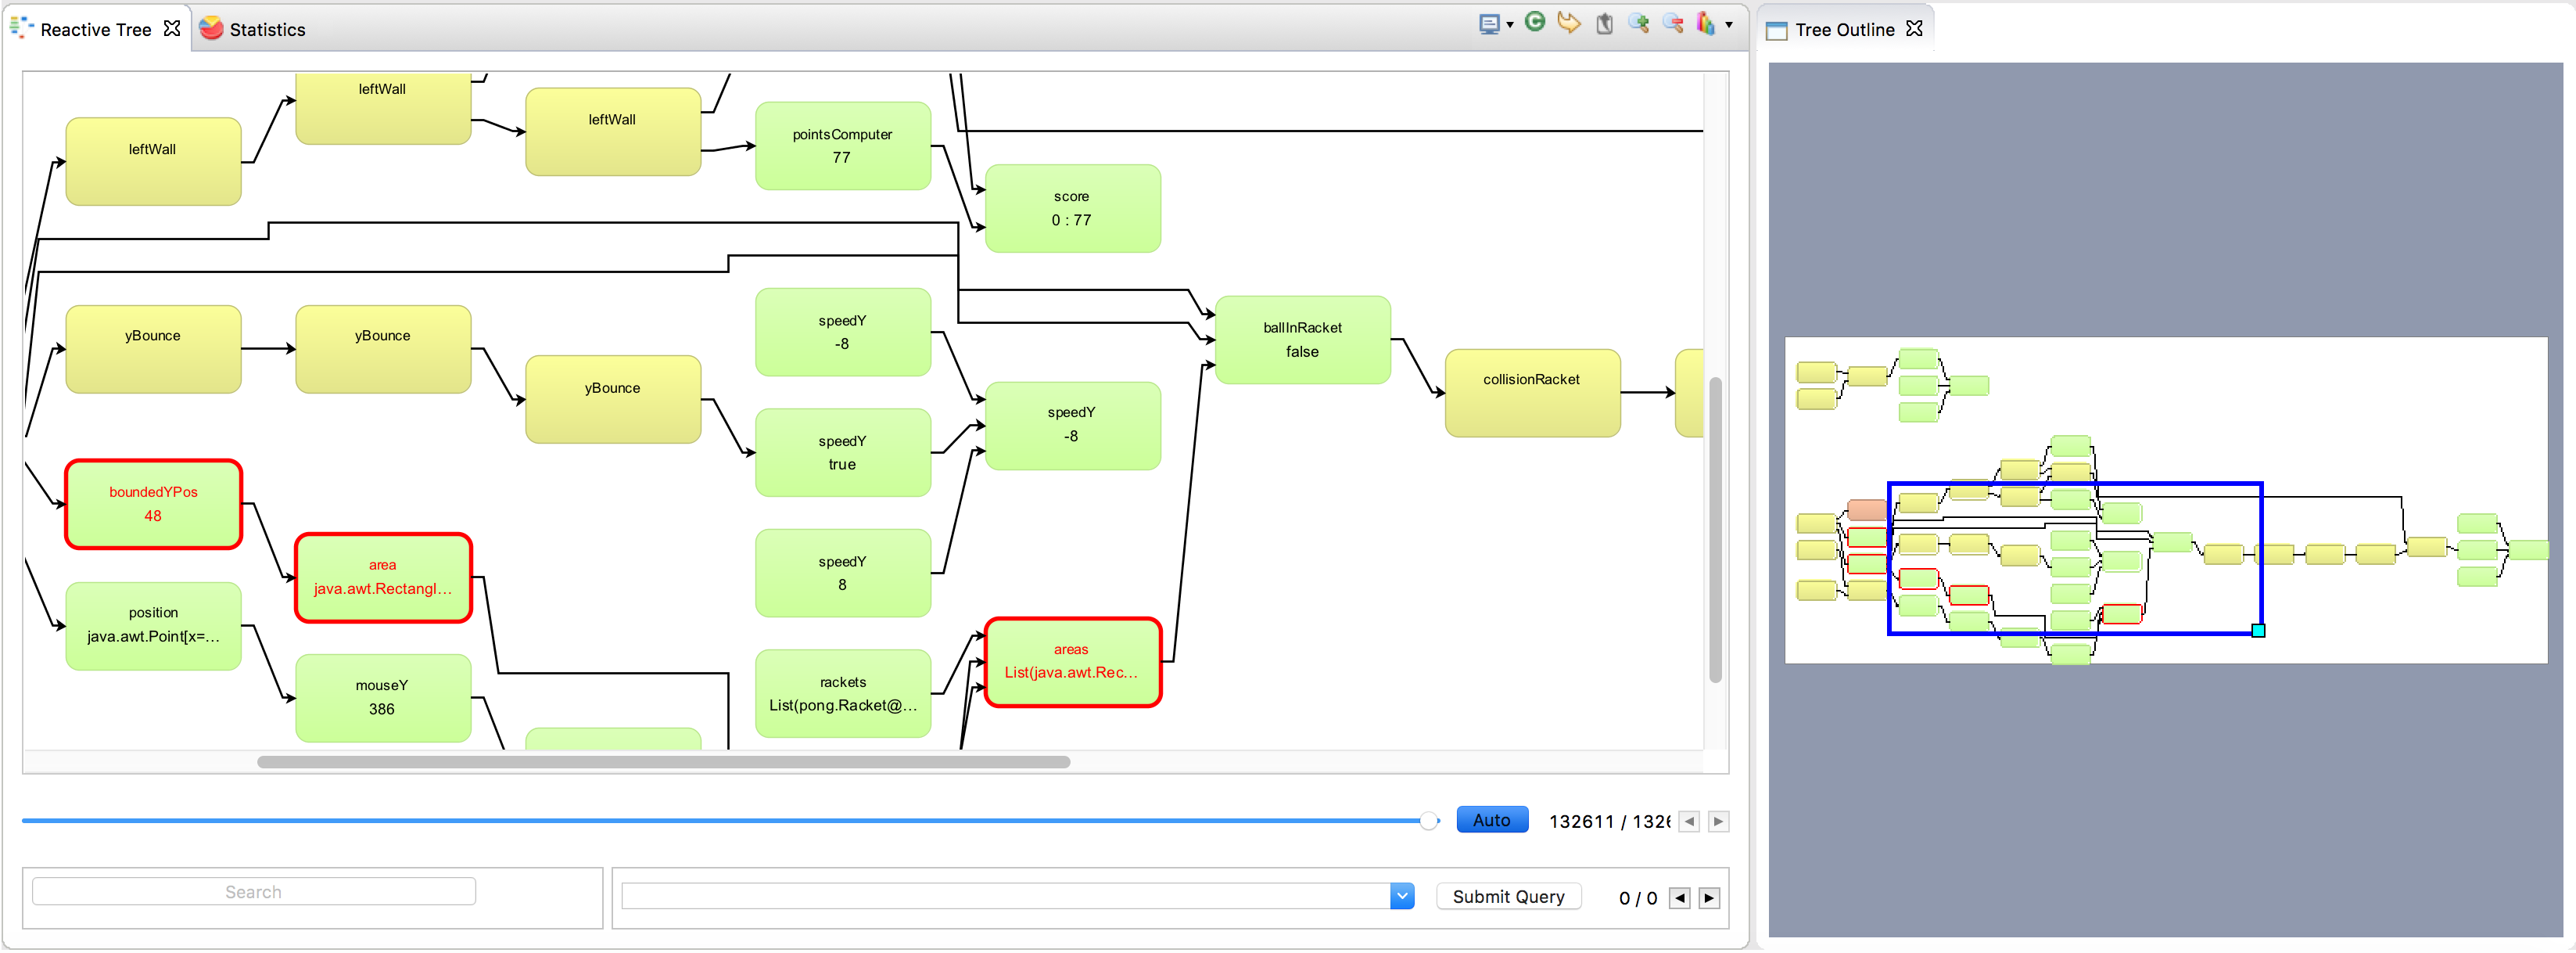 In a large dependency graph it is sometimes hard to navigate the reactive tree. This view shows you at a glance where you are in the graph and helps you jump quickly to a different area of the graph.
Time Travel
Ever needed to go back to a particular step in your program to inspect your variables values at that point in time? Well, Reactive Inspector makes this possible. It records all the values of each signal or variable and allows you to travel back in time through all states of the dependency graph.
History Queries
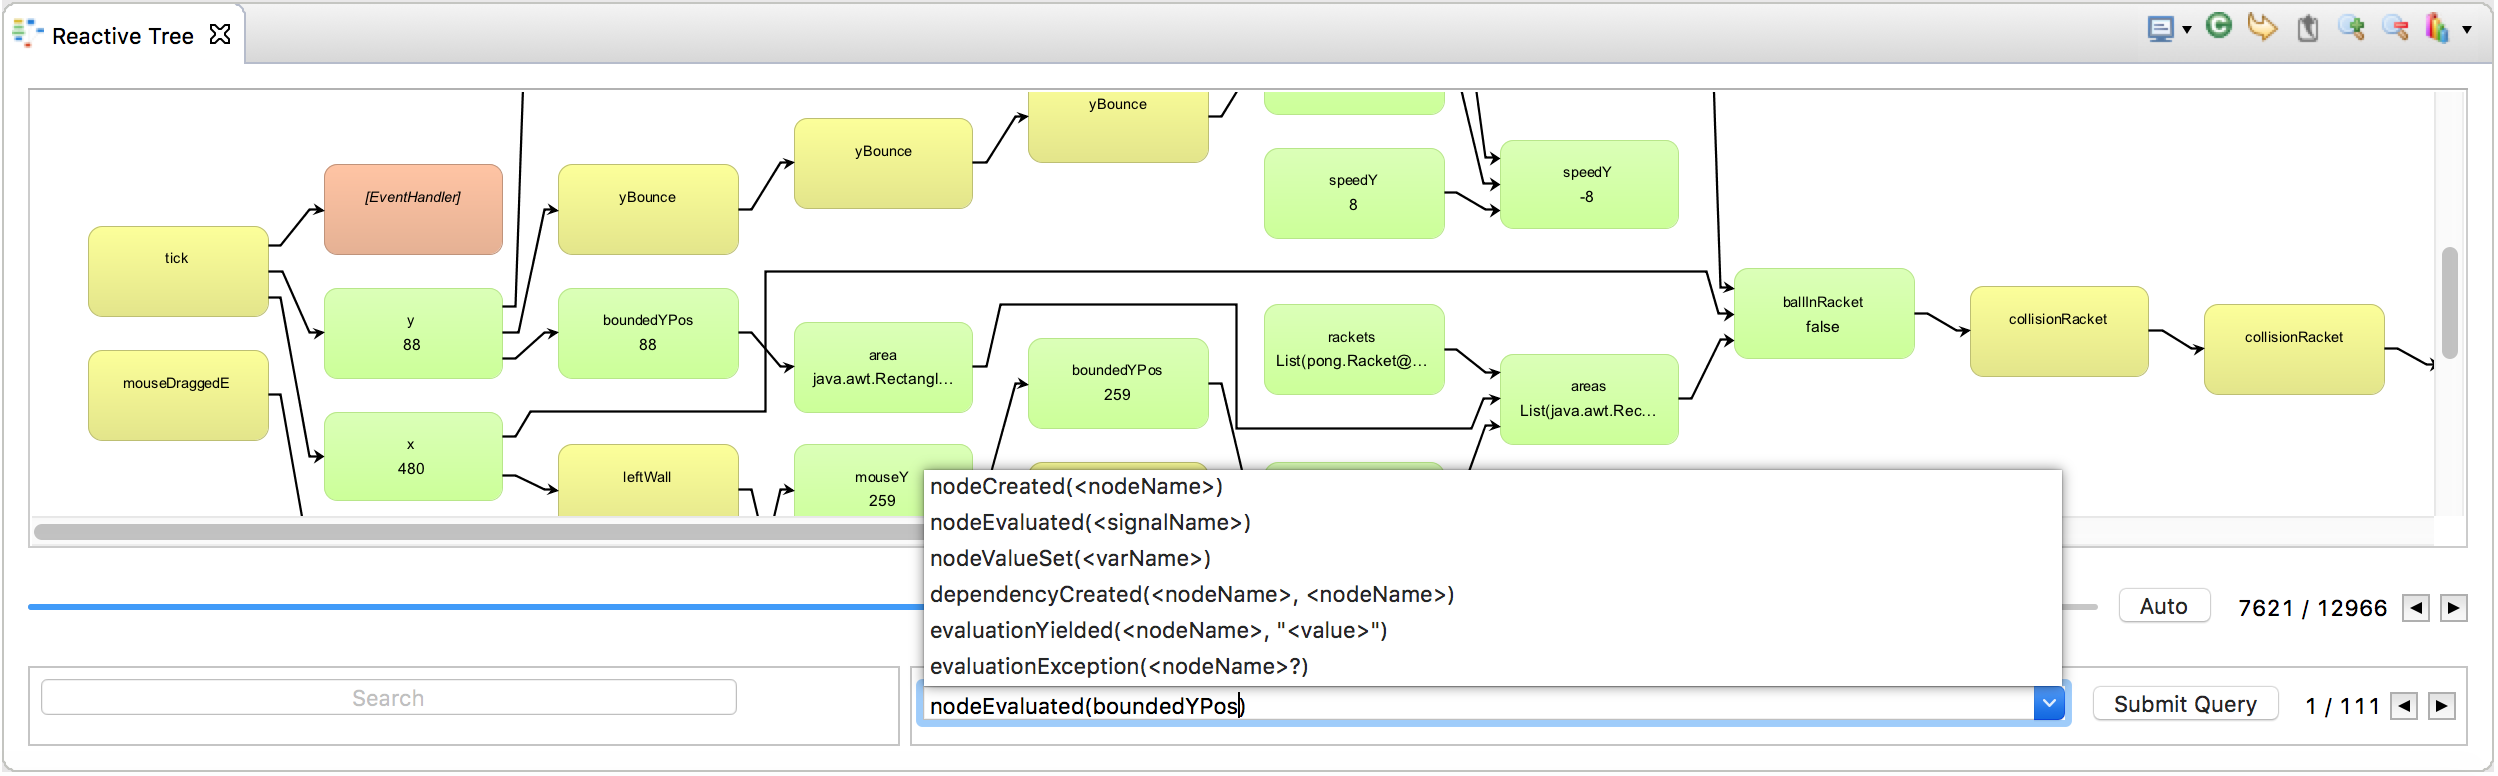 Scrubbing through past values may become cumbersome with a large dependency graph and a long history. With History Queries you can search in the history for specific relevant events.
Reactive Breakpoints
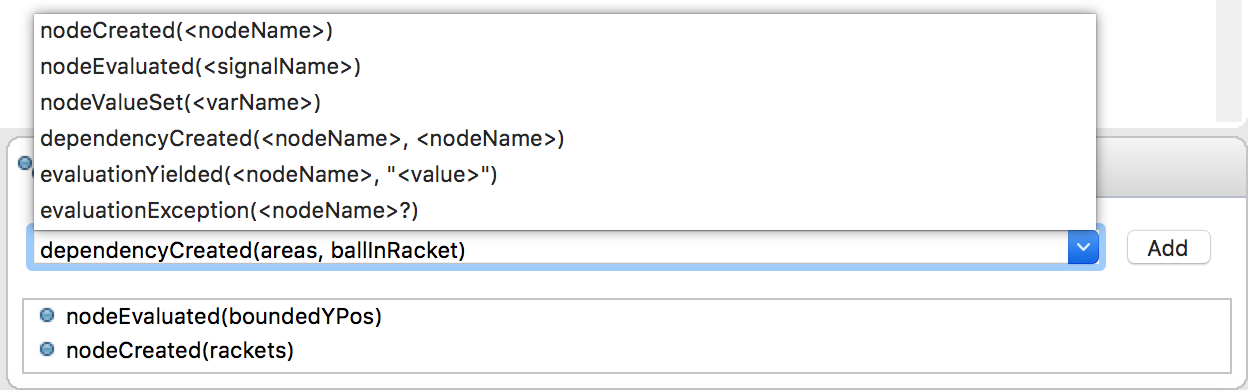 Reactive Breakpoints give you the chance to set breakpoints at certain relevant events in the graph evolution. Create queries, such as
 nodeEvaluated, and the debugger will stop the execution if an event matches the query.
Time Profiling
- Relative Performance - shows the number of evaluations of each node
- Absolute Performance (latest) - shows the duration of the last evaluation
- Absolute Performance (sum) - shows the sum of the evaluation times of the nodes
Node Search / Dependency Highlighting
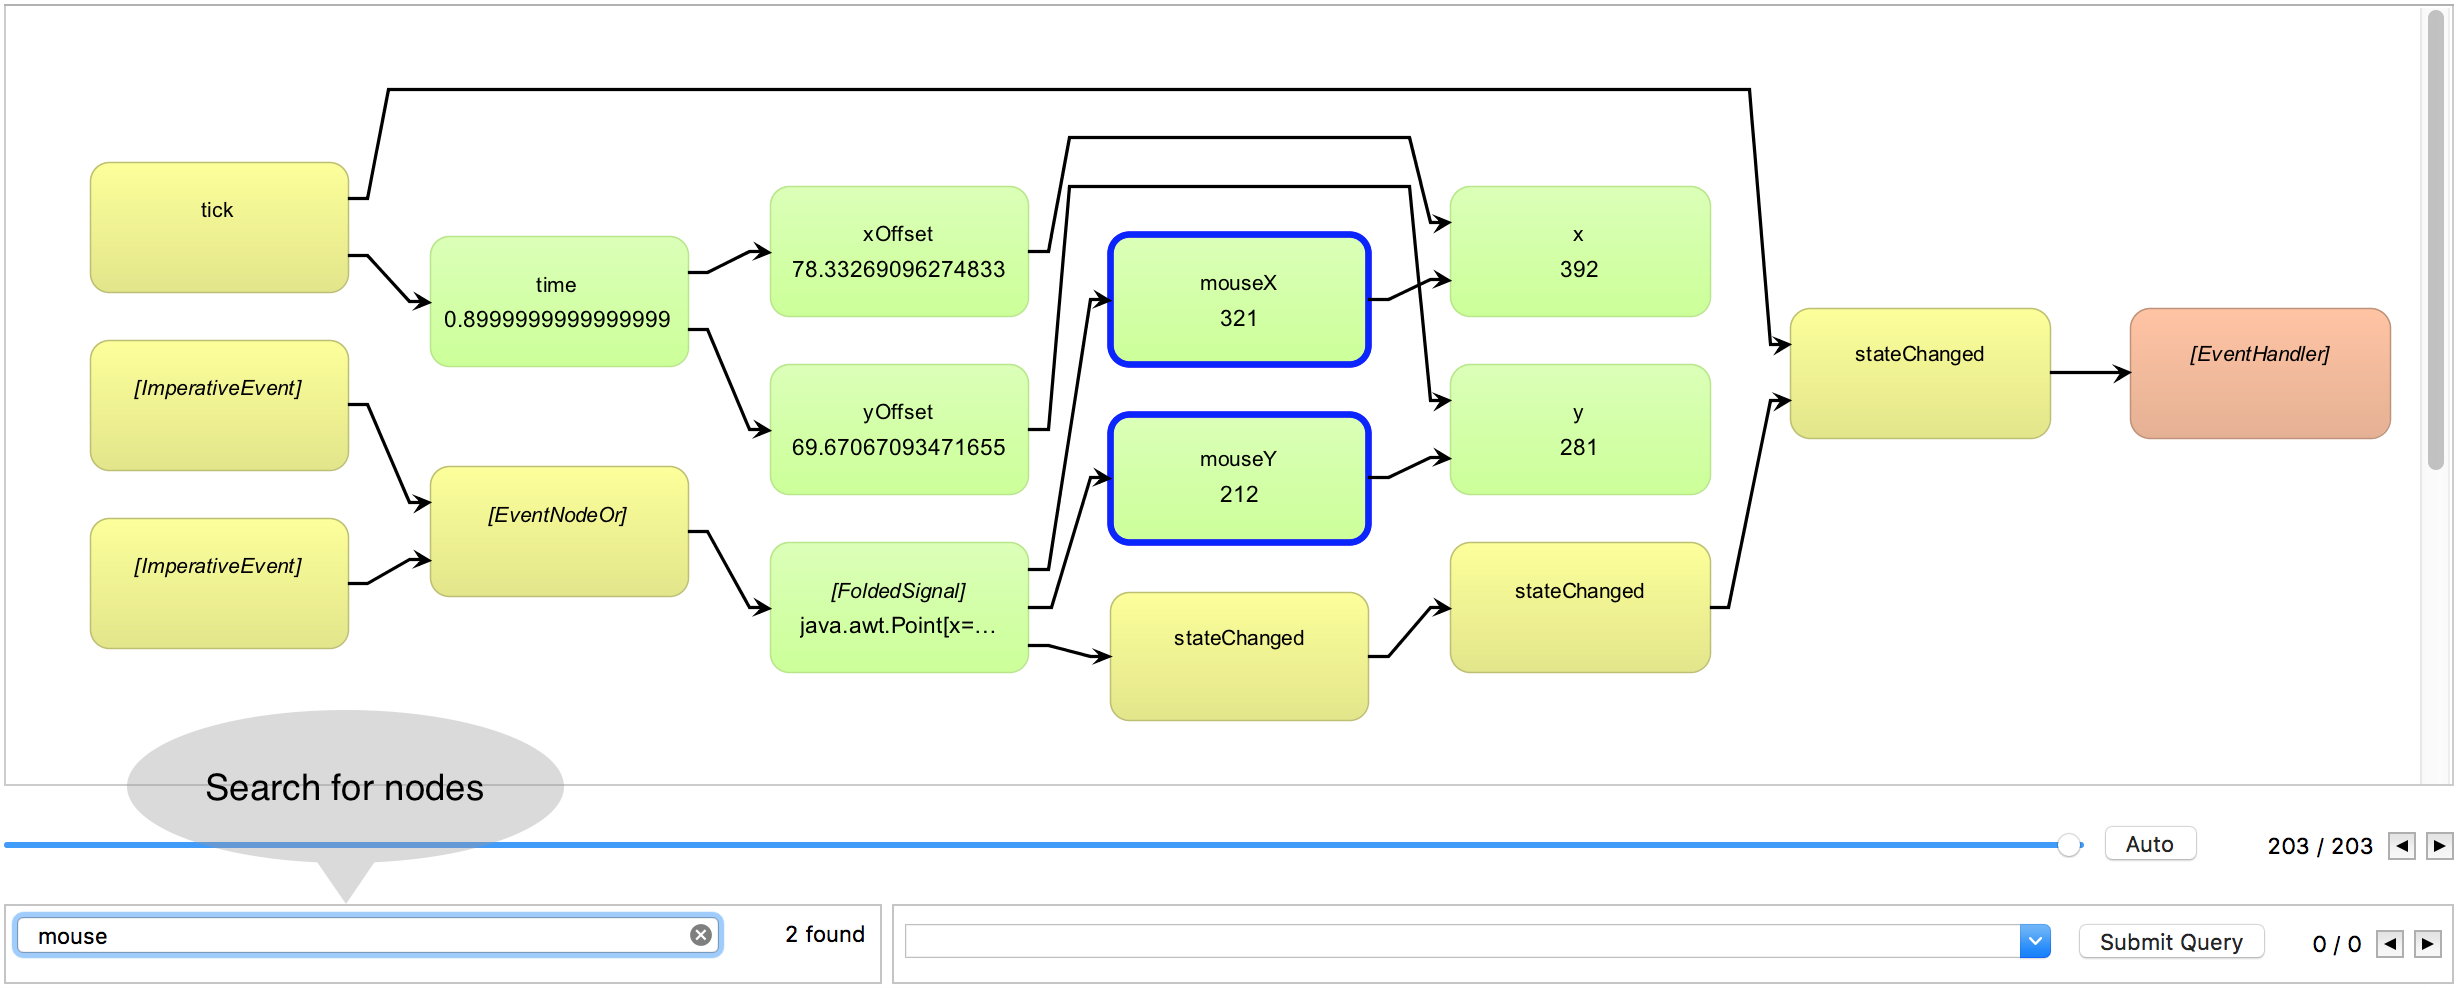 Reactive Inspector allows you to find nodes by their names. This makes navigation in large dependency graphs more comfortable.
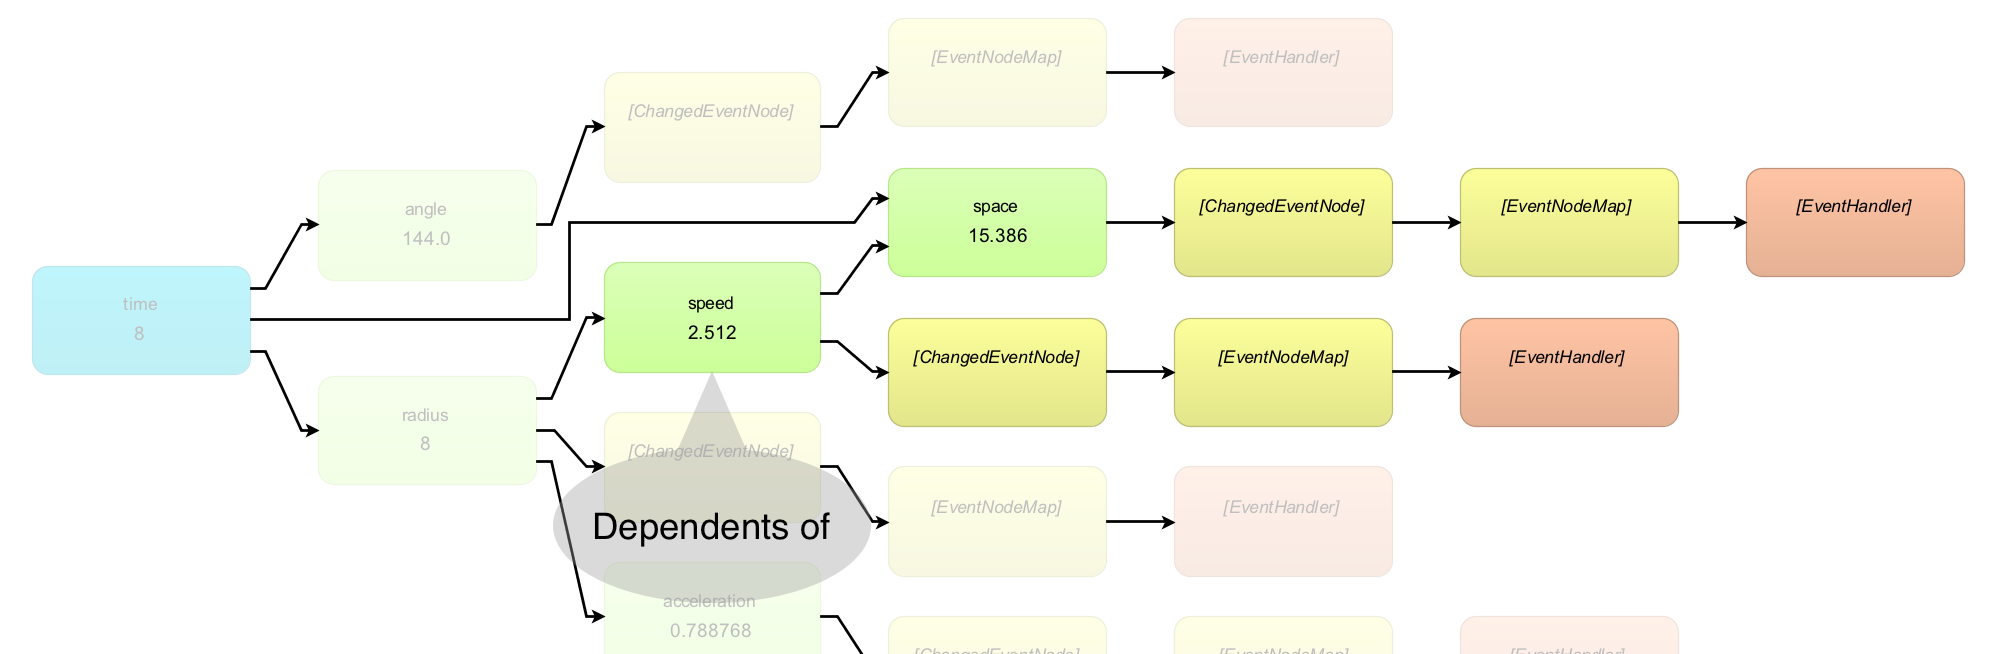
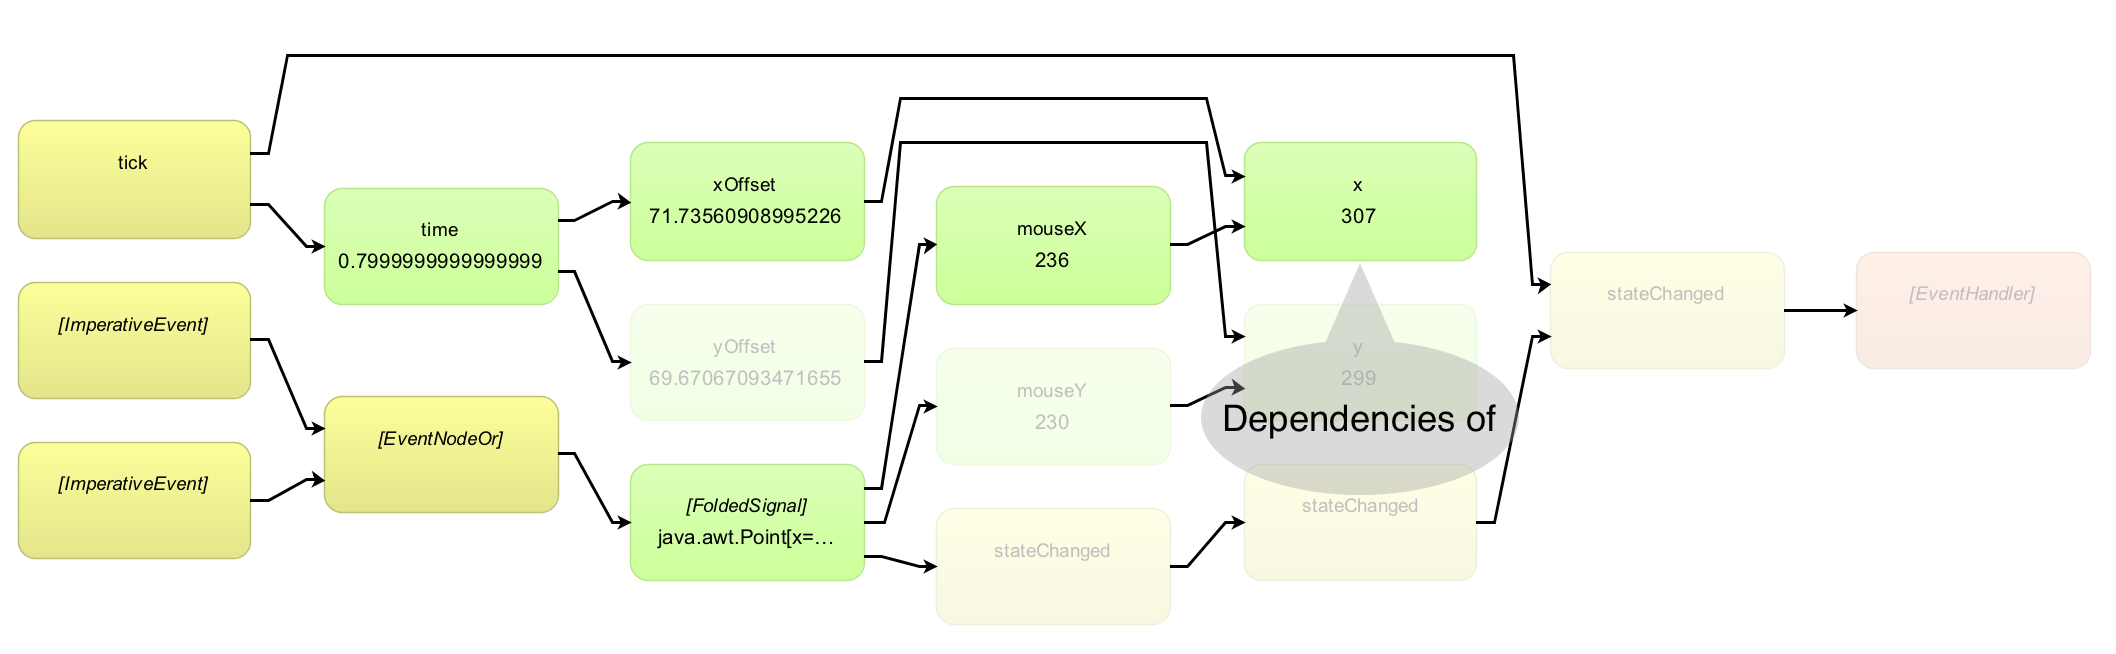 You can also highlight a node and all of its dependencies. This allows you to find the dependencies of a selected node much easier.
How to use Reactive Inspector
Supported Platforms
- IDE: Eclipse
- Language: Scala v. 2.4.1 and later
- RP Frameworks: REScala
Installation & Setup
- Install and open Eclipse (the Scala IDE is recommended).
- Help -> Install New Software...
- Add the REclipse update site: https://dl.bintray.com/m1c3/generic
- Select the just added REclipse update site from the drow-down.
- Install the REclipse plugin from the Reactive Programming category.
Create a new project
If you want to create a new project with REclipse support you can use the Reactive Inspector template project contained in this repository as a starting point.
You can import the project into Eclipse via sbt:
sbt eclipse- Eclipse: File -> Import...
- Select General -> Existing Projects into Workspace
- Select the cloned template project.
Use an existing REScala project with REclipse
Add the REScala Logger to the dependencies of the build.sbt:
"de.tuda.stg.reclipse" %% "rescala-logger" % "0.1"
Add a resolver for the REclipse maven repository in the build.sbt:
resolvers += Resolver.bintrayRepo("m1c3", "maven")
Attach the REScala Logger to REScala's logging in the main method of your application (or at a place before any Var, Signal or Event is created):
rescala.ReactiveEngine.log = new REScalaLogger
Academic publications
Guido Salvaneschi, Mira Mezini, Debugging for Reactive Programming, International conference on Software Engineering, ICSE 2016 (Pdf).
Guido Salvaneschi, Mira Mezini, Debugging Reactive Programming with Reactive Inspector, International conference on Software Engineering, ICSE 2016, poster (Pdf).
Ragnar Mogk, Pascal Weisenburger, Julian Haas, David Richter, Guido Salvaneschi, Mira Mezini, From Debugging Towards Live Tuning of Reactive Applications.
About
Reactive Inspector is a project started by Guido Salvaneschi at the Software Technology Group - Technical University of Darmstadt, Germany. Many people contributed to the project: